For the analysis of roundness, surface roughness, and profile roughness
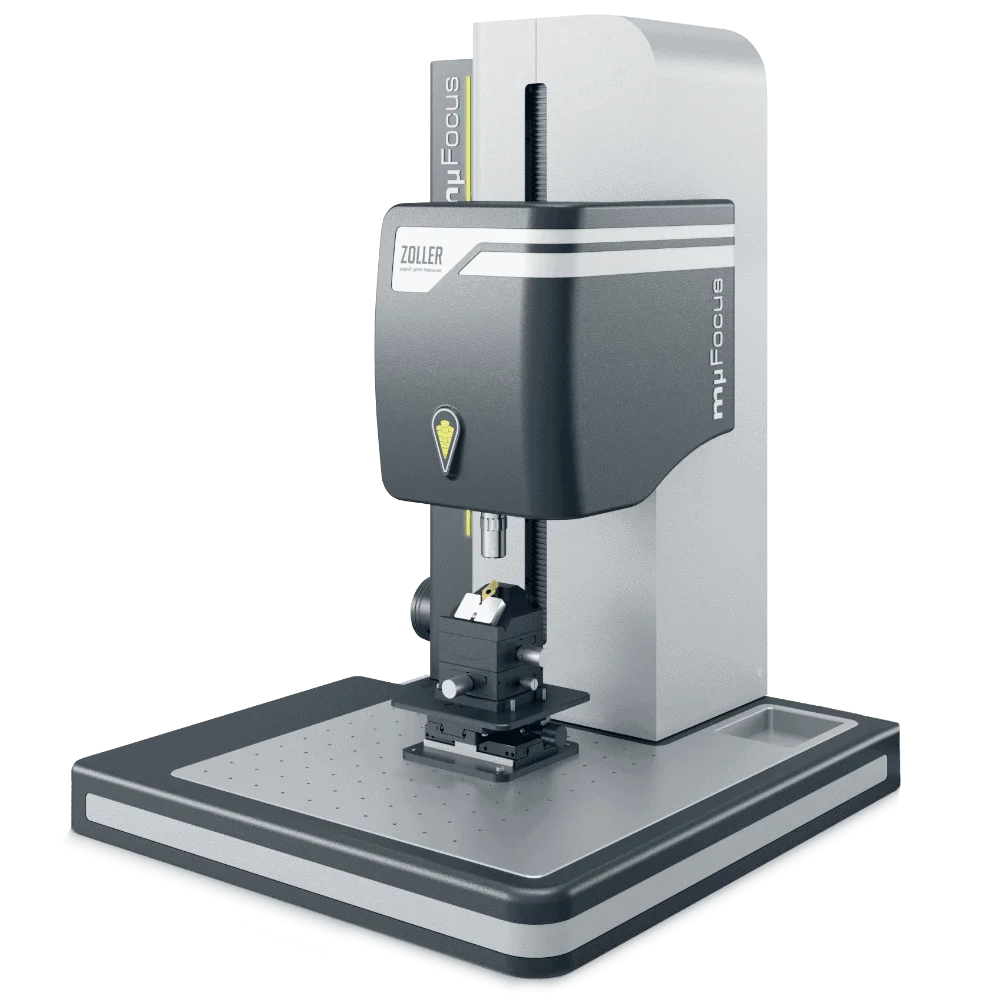
Comprehensive protection of components
Comprehensive protection of components
The measurement technology and mechanics of »mμFocus« are securely protected against moisture, dirt, and dust. This ensures a long service life and makes »mμFocus« ready for use directly on the production floor. No special measurement rooms are required.
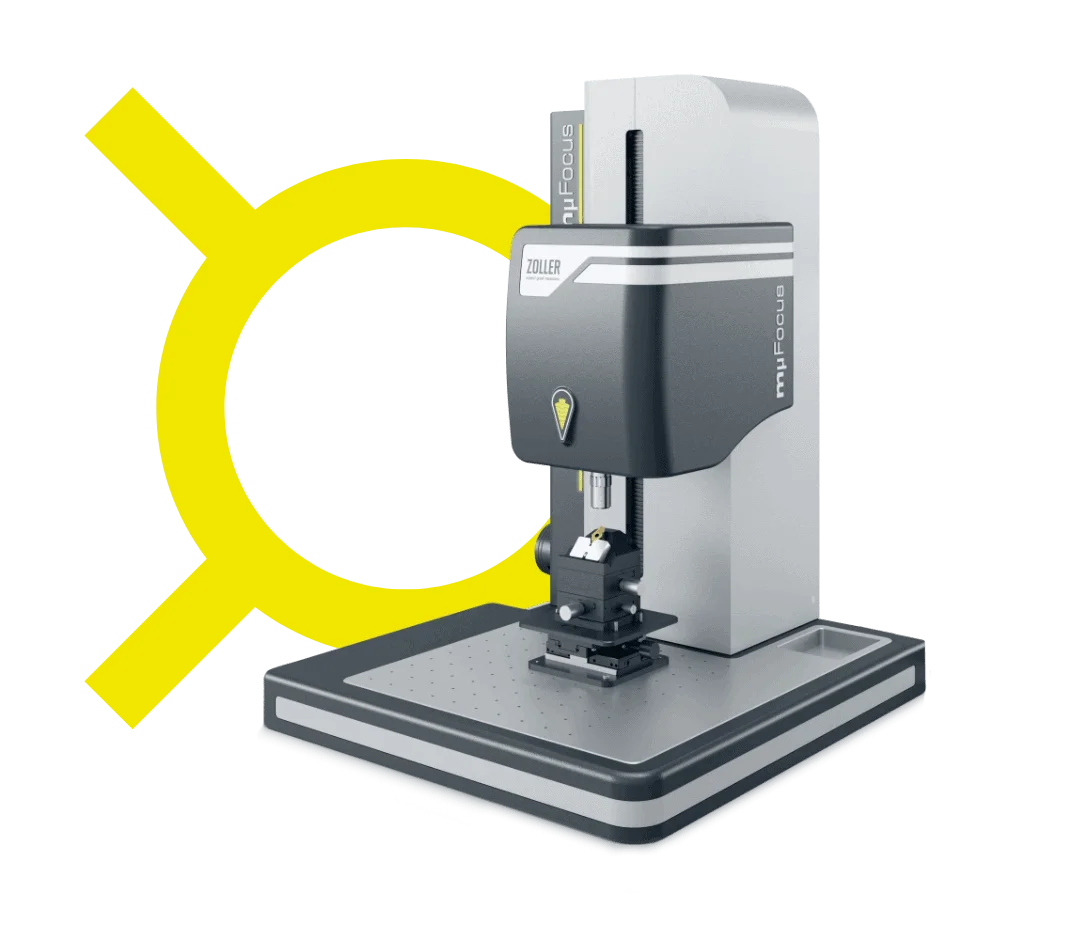
Fine adjustment
Manual fine adjustment of the Z-axis
After manually pre-positioning the sensor, use the precise handwheel to adjust it to the correct height, thereby precisely aligning the focal plane with the desired cutting area.
Types of Measurement Sensors
Sensor Variants
The blue symbol indicates the version with the »zep« sensor (ZOLLER Edge Preparation). This allows you to measure the cutting edge preparation with high precision.
If this symbol is yellow, the optional confocal microscope with the »zep-R« sensor (ZOLLER Edge Preparation Roughness) is installed. This sensor additionally analyzes surface roughness.
Tool holders
Many tool holders available
With the wide range of optional tool holders available, you can use »the mµFocus« for a wide variety of tools—for example, for tools with collets or for indexable inserts.
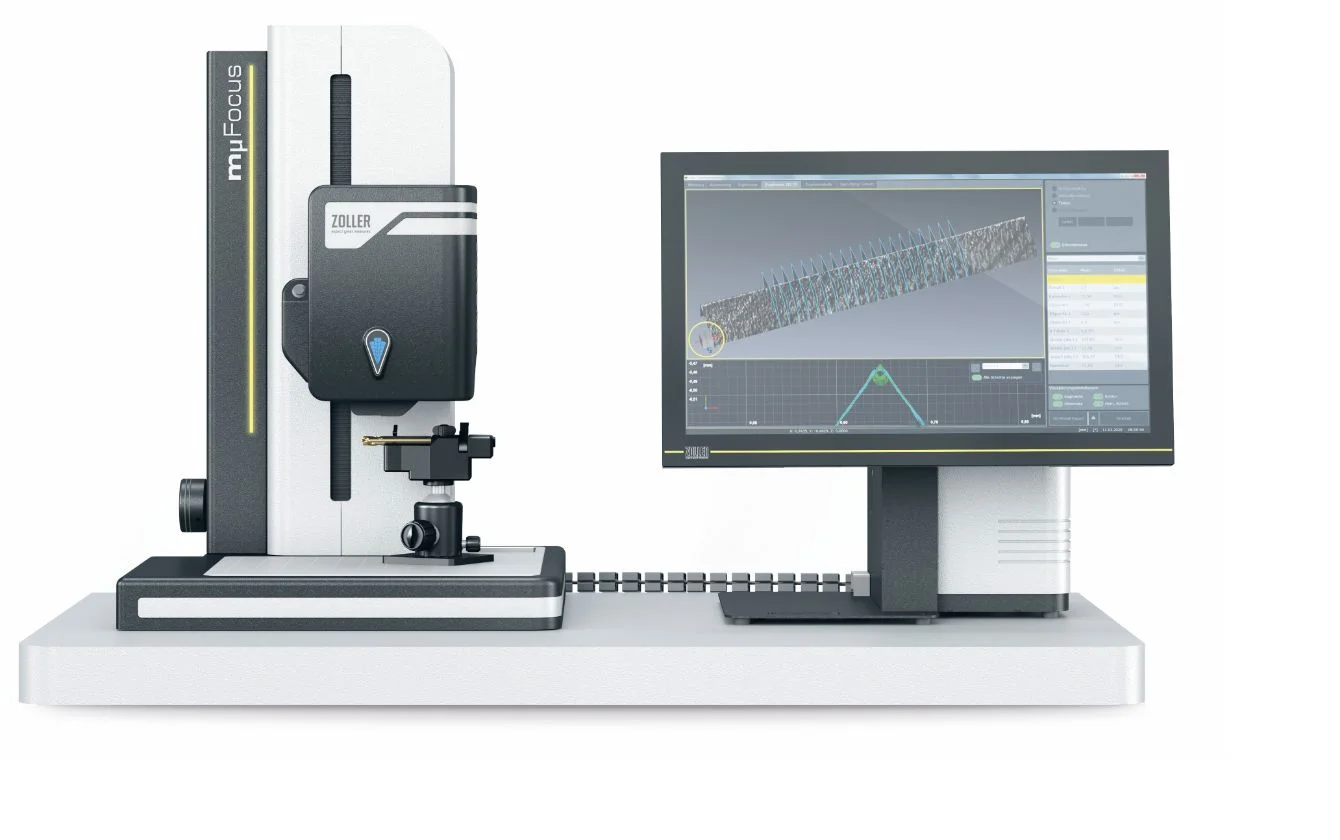
Measurement »Software pilot 4.0«
Measurement »Software pilot 4.0«
The »pilot« device software offers you a high level of convenience. Selection and input fields are clearly laid out, all functions support efficient work, and you have many options for processing and displaying measured values.
Comprehensive protection of components
The measurement technology and mechanics of »mμFocus« are securely protected against moisture, dirt, and dust. This ensures a long service life and makes »mμFocus« ready for use directly on the production floor. No special measurement rooms are required.
Manual fine adjustment of the Z-axis
After manually pre-positioning the sensor, use the precise handwheel to adjust it to the correct height, thereby precisely aligning the focal plane with the desired cutting area.
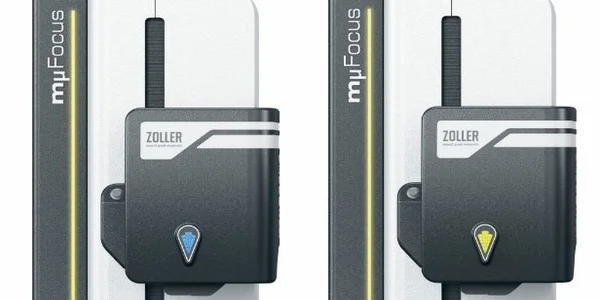
Sensor Variants
The blue symbol indicates the version with the »zep« sensor (ZOLLER Edge Preparation). This allows you to measure the cutting edge preparation with high precision.
If this symbol is yellow, the optional confocal microscope with the »zep-R« sensor (ZOLLER Edge Preparation Roughness) is installed. This sensor additionally analyzes surface roughness.
Many tool holders available
With the wide range of optional tool holders available, you can use »the mµFocus« for a wide variety of tools—for example, for tools with collets or for indexable inserts.
Measurement »Software pilot 4.0«
The »pilot« device software offers you a high level of convenience. Selection and input fields are clearly laid out, all functions support efficient work, and you have many options for processing and displaying measured values.
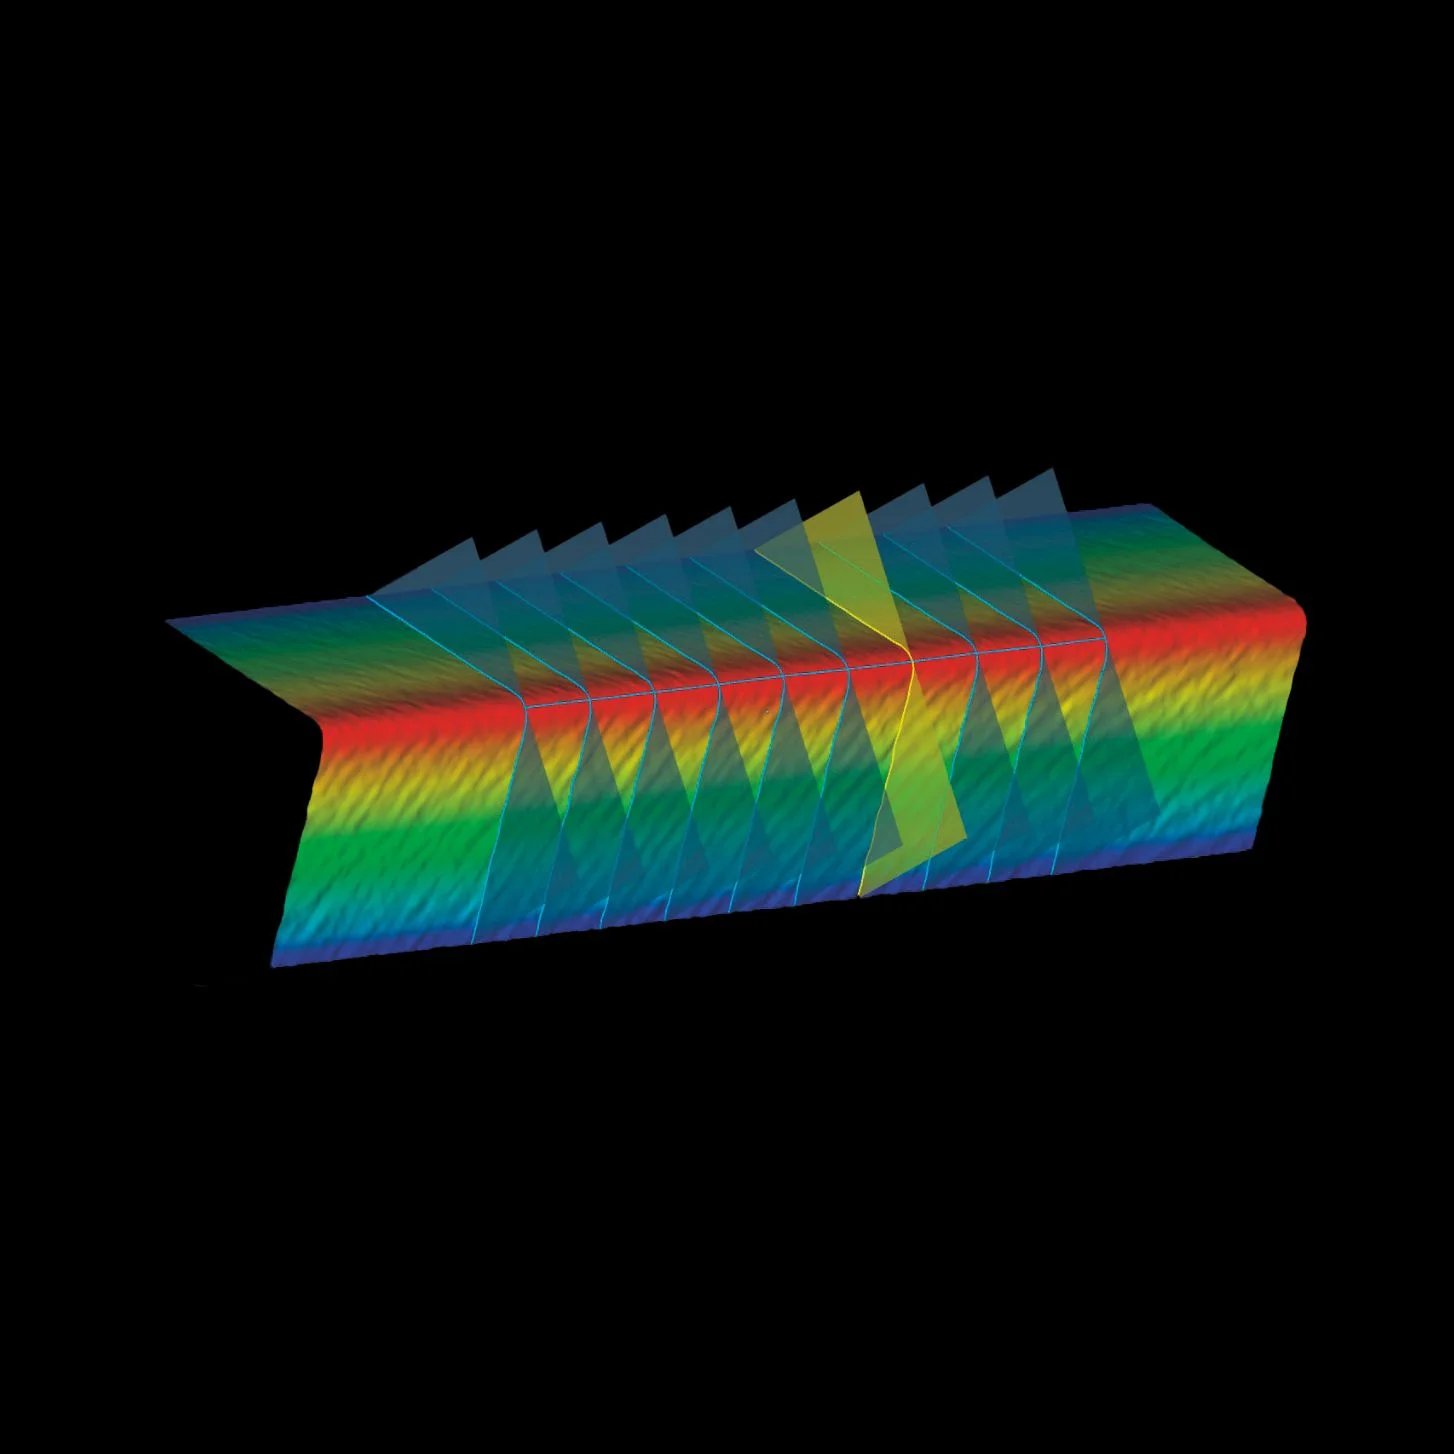
High-precision three-dimensional images
Using numerous individual images, »mµFocus« calculates highly accurate 3D representations of the tool cutting edge. You determine the level of detail by specifying the number of images. You can view the measurement results topographically, in grayscale, as measurement curves, or in a table format in accordance with DIN standards. The most comprehensive view of tool cutting edges.
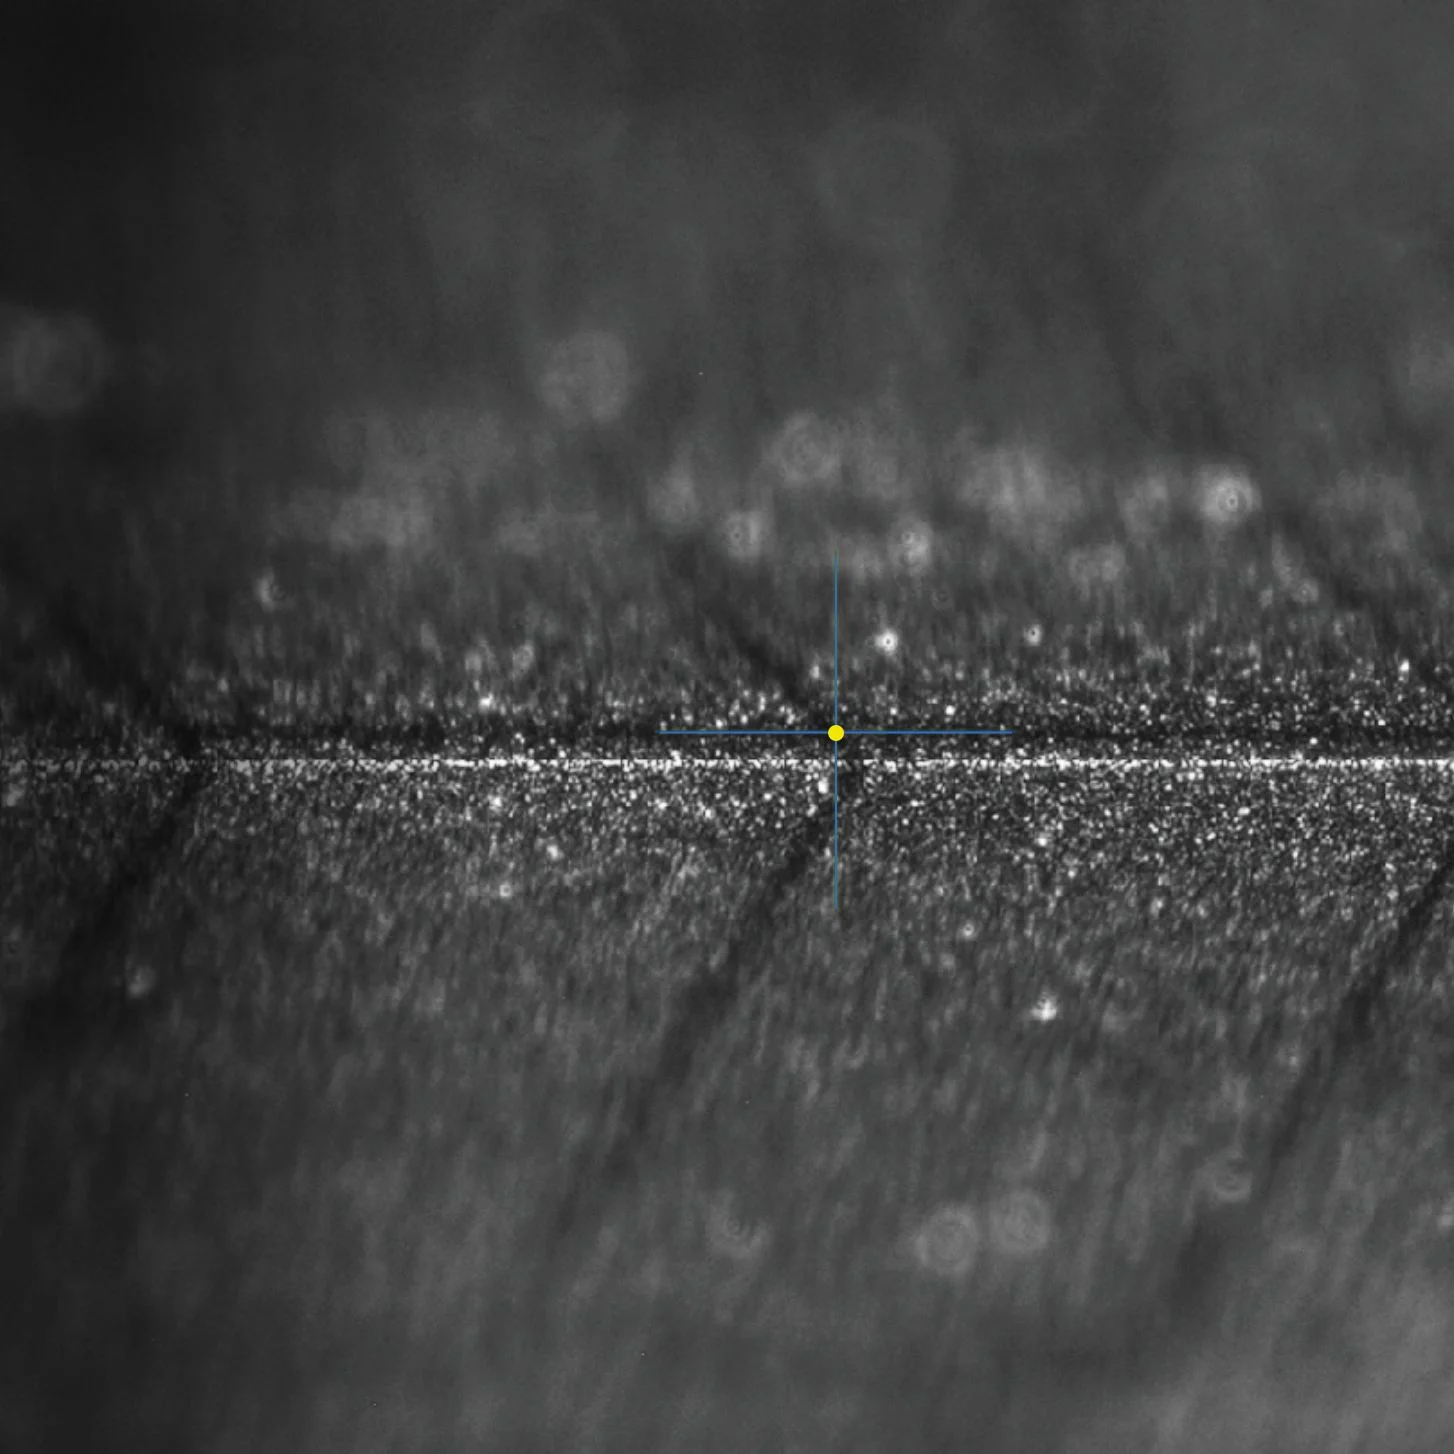
Detecting roughness using color-coded topography
»mµFocus« visualizes the roughness quality factor using easily distinguishable color codes. Light and dark blue dots represent depressions, while yellow and red dots indicate elevations. The light blue line represents the measurement path. For example, scratches can be quickly identified using the color coding.
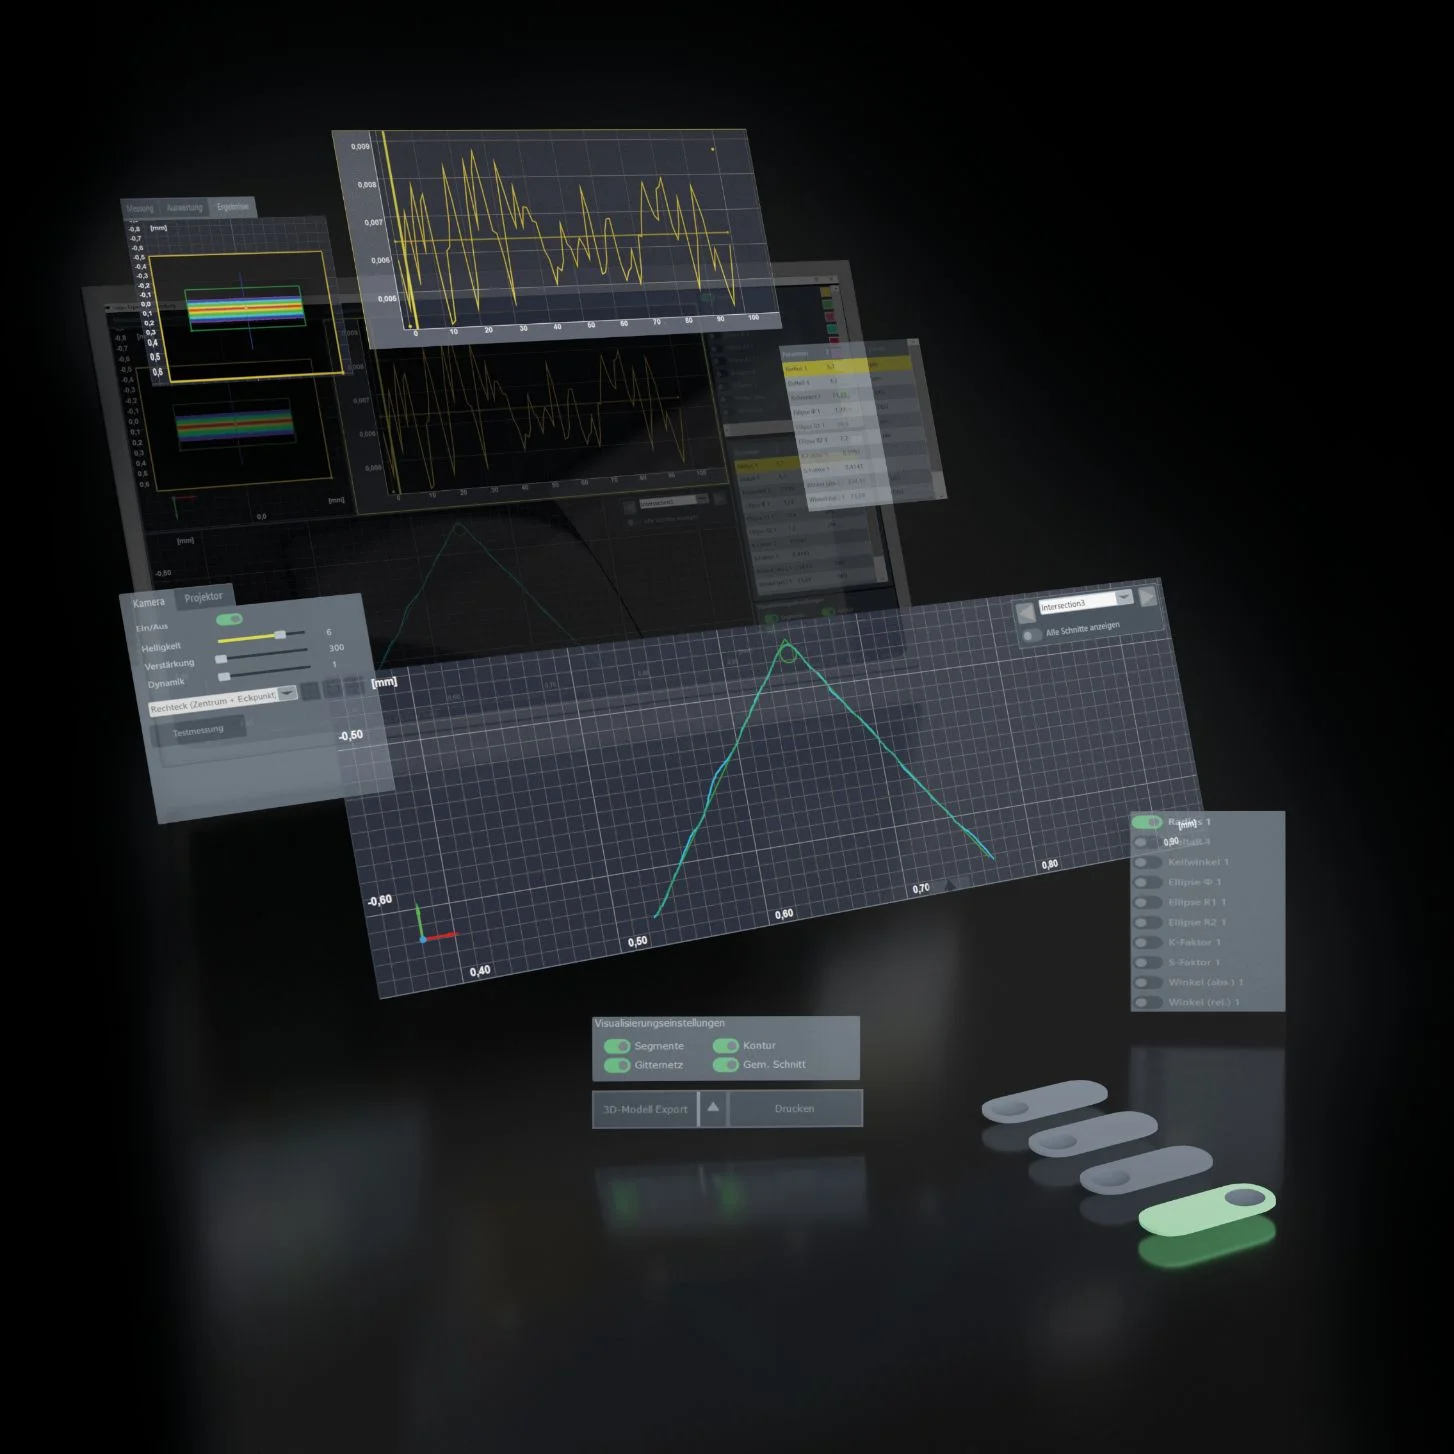
»pilot 4.0«: Perfection with image data
»pilot 4.0« provides the perfect support. This software is characterized by its ease of use, clear icons for cutting edge shapes, and quick navigation through the menu structure. The integrated image processing generates informative charts and 3D visualizations from image data. You’ll immediately recognize the distinctive signature of your tool manufacturing.